
Basic transfer point.
A common transfer chute moves material from one conveyor to another. Chute Maven Classic helps evaluate whether the geometry, belt conditions, and material behavior support the required operating conditions.

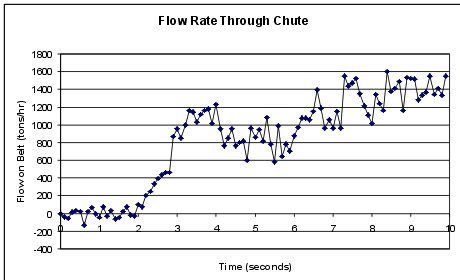
Capacity questions
Can the chute handle the target tonnage, and what happens when belt speeds increase?
Dust and flow control
Can chute geometry changes guide the flow more cleanly through the transfer?
Receiving belt protection
How does the material load onto the receiving belt, and where might impact or wear need attention?
Geometry setup
The chute and belting are drawn in AutoCAD using supported 3D surfaces. The belt transition distance and the height of the last idler set before the discharge pulley are important details because they affect the material trajectory leaving the pulley.
The sample files are available on the downloads page.
Example conditions
This example uses material density, flow rate, particle size distribution, and belt speeds as part of the simulation setup. Results can be reviewed visually and exported for engineering discussion.